
Download White Paper here.
EXECUTIVE SUMMARY
Many industries seeking to decarbonize and lower their emissions footprint are increasingly looking for opportunities to reduce upstream scope 3 emissions through access to certified lower methane-intensity natural gas.
Upstream methane emissions are a significant contribution to the lifecycle emissions footprint of many chemical and other industries that rely on natural gas as a feedstock. This potentially contributes more than 20% of a product’s lifecycle emissions, according to Argonne’s Hydrogen Pathways (2022), depending on the basin it was derived from. Given the potency of methane emissions as a greenhouse gas (GHG), efforts to provide industries access to documented lower methane-intensity natural gas could have very concrete benefits for the environment. Such an approach can also foster the growth of market-based incentives for natural gas producers to reduce their emissions as they seek to certify their products.
This paper explores the significant role of methane emissions in the lifecycle GHG emissions of ammonia production. It documents how lower methane-intensity natural gas can reduce scope 3 emissions by approximately 60% using a nation-wide measurement-informed US methane loss average and overall lifecycle GHG emissions from ammonia by approximately 15% for traditional SMR production and well over 50% for blue ammonia. To ensure the use of such lower intensity natural gas, there are well accepted certification and accounting methods that provide a clear approach for the documentation and verification of certified natural gas.
Modeled emission estimates, by contrast, such as national inventories or baselines, lack the granularity and operator-specific inputs necessary to demonstrate true regional emissions. Certification provides greater accuracy in the lifecycle analysis and provides incentives for interested natural gas producers and industrial end-users to develop a robust and functioning market for lower methane intensity natural gas.
With specific, audited and registry tracked emission information, therefore, certified natural gas is an important pathway for emissions reductions by industry natural gas end-users that will, once widely deployed, provide a substantial opportunity for very significant emissions reductions.
1. Introduction
Upstream methane emissions are gaining focus for industries for which natural gas is a feedstock as lifecycle carbon intensity becomes an increasingly important product attribute. Natural gas buyers and users have an incredibly important role in driving methane leakage reductions from the natural gas supply chain. Thanks to improved greenhouse gas reporting standards, tax incentives, and certification programs like MiQ, gas buyers can now understand and use their buying power to drive down scope 3 emissions from their product lines.
Reducing methane emissions is a critical opportunity for mitigating the impact on climate change as methane is a short-term climate pollutant and has over 29 times the warming potential of CO2 over a 100-year lifespan (IPCC AR6, 2021). This means reducing just a small amount of unintended methane leakage from the production, processing and transport of natural gas could have a substantial mitigation of near-term climate impacts, and in many cases much larger than the longer-term offsetting or reductions of CO2 emissions.
Accurately estimating and tracking the methane emissions from the natural gas supply chain is highly difficult with currently deployed technologies. Tracking emission for each molecule of gas as they move through the supply chain requires enhanced standards, monitoring and reporting. This is where certification can help drive progress and accountability.
Standards and certification programs need to be developed that (1) better quantify the unintended emissions; (2) are segment specific; (3) are linked with registries to ensure robust tracking through the supply chain; (4) provide performance standards and benchmarks to help buyers understand – what is a good intensity, or how leak free is my gas?
2. Verifying Actual Emissions Intensities
2.1 Life cycle analyses
Accounting for upstream natural gas methane intensity requires a complete analysis of the full supply chain from production, to gathering and boosting, to processing, to storage, to long haul transmission and transport. Gas buyers have various options when accounting for their upstream or Scope 3 methane emissions, each delivering various levels of confidence, accuracy and completeness. Current options for gas buyers in estimating their full supply chain emissions range from the granular and specific, through the use of certification schemes, to the generic and potentially inaccurate, through the use of inventories, models and geographical top-down analyses. Key to all methods is a discussion of the inputs utilized as well as any potential sources of uncertainty.
2.2 Tracking of Methane Emissions Intensities using Credible Certification Schemes
Certification provides the opportunity to more accurately account for methane emissions at the operator level. However, credible certification schemes rest upon a number of key principles to account, verify and track emissions through the natural gas supply chain, including (1) transparent standards, (2) independent third-party audits, and (3) use of registries.
To achieve accurate and specific methane intensities for each natural gas operator, we must rely on transparent, scientifically backed emissions accounting standards. The MiQ Standard for each segment of the natural gas supply chain credibly and dependably determines methane intensities using a three-pronged system which evaluates (a) a company’s calculated and reconciled emissions inventory, (b) the degree of emissions prevention achieved through best operating practices, and (c) the frequency and coverage of emissions monitoring over an entire operator’s assets. Due to the difficult nature of accounting for both intended (i.e., process related emissions) as well as unintended emissions (i.e., those from leaks, abnormal process conditions, or faulty practices), calculated methane intensities must reconcile both bottom-up and top-down data sets. Bottom-up data might include enhanced engineering calculations or facility specific emission factors which evaluate the expected emissions for a series of operations provided the actual equipment inventory and activity factors are validated. Top-down data might include ground level leak surveys using optical cameras, as well as quantitative, enhanced leak detection surveys which characterize major abnormal process conditions, such as unlit flares, tank emissions, compressor leaks, combustion slip, poorly executed blowdowns, etc., each known to significantly contribute to an emissions inventory. Only when both sets of data are combined and the data set extends to an operator’s entire assets, do we have a full picture of the segments’ emissions intensity. Thanks to the monitoring and emissions prevention requirements in the MiQ Standard, both key ingredients to emissions reduction, the calculated emissions for a given segment can be determined down to a confidence level of 0.05% methane intensity or less.
The second important ingredient in a certification scheme are independent third-party auditors to review an operator’s emissions accounting, top-down monitoring results, company operating procedures, record keeping, operator training and know-how, company culture and maintenance events, to properly assess their performance against the Standard. In a credible certification scheme, independence means each third-party validator must be free of financial conflict from the certifier, operator, or data providers. Conflicted and opaque “self-certification” schemes by various operators and for-profit intermediaries are becoming a popular trend in the sustainability space. Natural gas buyers must now be extra cautious of potential greenwashing claims from uncredible programs lacking this key, yet simple and fundamental ingredient.
Registries for tracking emissions and their associated molecule of natural gas are critical in any complex supply chain involving multiple operators and multiple segments. Registries accurately link emissions intensities from supply chain segments occurring in series, as well as track the issuance, usage and retirement of certificates to prevent double counting of emissions or claims of reduced emissions. Digital registries are simple, low-cost instruments utilized in a number of credible tracking systems such as Renewable Energy Credits (RECs) and Renewable Natural Gas (RNG) programs.
2.3 Application of Baselines
Generic emission estimates for a country or region are necessary to understand the average impact a fuel or commodity might have on an industry or economic process. These broader estimates have multiple use cases, such as global reporting to the UNFCCC, however this paper will focus on the application of generic inventories and models to support baseline estimates for voluntary and regulatory emissions accounting programs.
Several country-wide estimates have been constructed from various sources of emissions data that range in spatial coverage and calculation methodology. Some utilize bottom-up emissions data from national inventories such as the EPA’s Greenhouse Gas Reporting Program (GHGRP) or the Greenhouse Gas Inventory (GHGI), while others use top-down emissions data gathered from aerial surveys or other measurement-based data collection efforts. To date, these are believed to undercount methane risk by at least 50% (Rutherford, 2021). The MiQ-Highwood Index is a measurement informed national average for methane loss across the entire natural gas supply chain, estimating 2.2% average methane loss applying top-down aerial measurements and bottom-up models. Due to the wide range of performances from various basins, there are as many pathways that emit more than 2.2%, than emit less. The Argonne National Laboratory’s Hydrogen Life-Cycle Analysis in Support of Glean Hydrogen Production (Elgowainy et al, 2022) apply the GREET 2021 model from Natural Gas Pathways, which takes a “hybrid” approach that attempts to supplement bottom-up emissions inventories with top-down studies, such as that from Alverez et. al 2018. It should be noted that the GREET-hybrid approach still significantly undercounts methane emissions compared to measurement studies by Alvarez et al (2018), Rutherford et al (2021) and the MiQ-Highwood Index (2023). The proposed lifecycle emission targets in the US Department of Energy’s Clean Hydrogen Production Standard (2022), used were derived using GREET.
Generic models have numerous downsides for application towards an individual natural gas end-users emissions reporting. Models must make use of country-wide or region-wide averaged inputs such as the type of equipment used, emission and activity factors, and estimated operating conditions or reservoir conditions. Given the broad distribution of production types and gathering pressures and processing conditions and transmission distances throughout the United States, such generic inputs may be grossly over simplified or divergent from actual conditions from which the natural gas was sourced. Life cycle models also do not consider specific mitigation activities an upstream supplier might have taken to minimize their emissions such as through capital improvements, electrification, elimination of flaring, vapor capture or increased monitoring. Natural gas end-users hoping to demonstrate reduced emissions by sourcing their gas from specific operators or specific fields will often be penalized with higher emission estimates than in reality or their choice dictated. Likewise, for indiscriminate natural gas end-users, these models might underestimate their impact or choices, as illustrated above.
Regional or country-wide models, however, do serve as a critical tool for establishing baselines for which voluntary and regulatory emission schemes differentiate performance or improvements, year over year, or supply chain to supply chain. The MiQ-Highwood Index serves as the most up-to-date, measurement informed national average for methane intensity across the natural gas supply chain and serves as a good first step towards establishing a baseline for comparison of upstream methane emissions reduction initiatives like MiQ certification, as demonstrated below.
3. Ammonia Case Study
The development of and transition to low-carbon production pathways for industrial products like ammonia is a top priority in the decarbonization agenda for meeting global climate targets for both abatement of existing emissions and for hydrogen and ammonia to serve as zero-carbon sources of energy for hard to abate sectors such as power generation and maritime shipping. On a well-to-gate (WTG) or lifecycle basis, upstream methane emissions can contribute over 20% of ammonia’s carbon intensity, according to Argonne’s Hydrogen Pathways (2022). Certified gas provides a mechanism to reduce ammonia’s upstream methane emissions and lifecycle carbon intensity in meaningful ways.
The following case study is meant to demonstrate how certified gas can provide industrial consumers of natural gas with an effective means of reducing lifecycle carbon intensity.
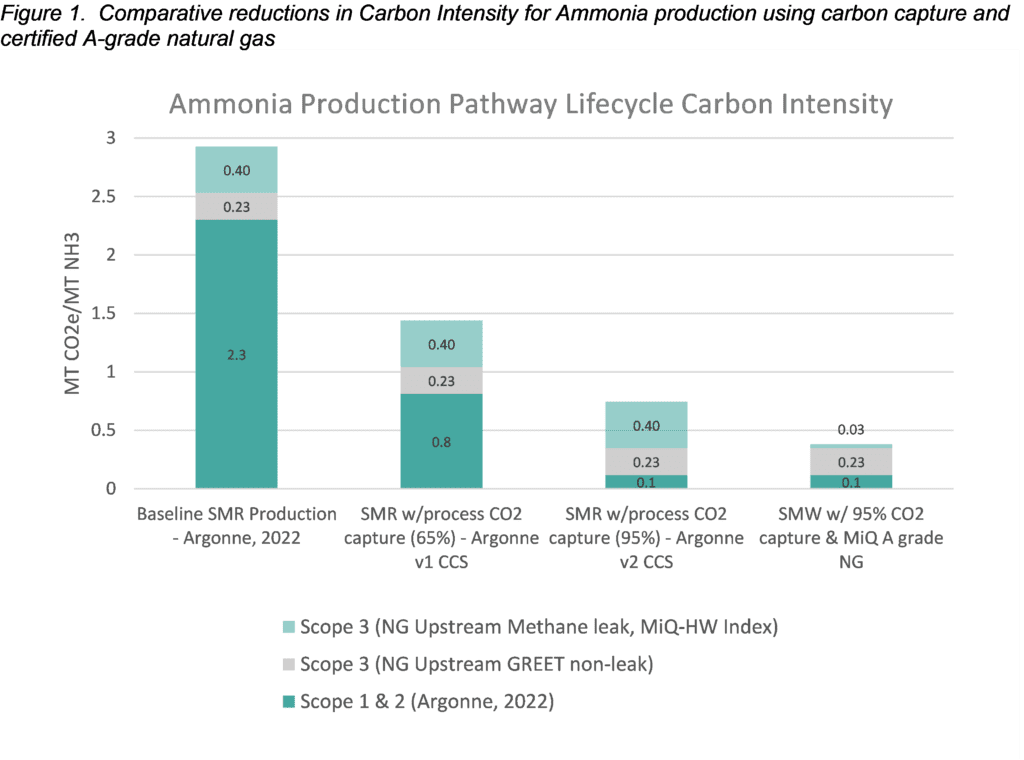
In the following theoretical case of production of 1500 short ton per day ammonia (NH3) manufactured through steam methane reforming (SMR) of natural gas, we present the estimated Scope 1 & 2 process emission from Lee et al, 2022 (Argonne Study), and then estimate the decrease in carbon intensity for supply chain emissions through sourcing of certified low-methane leakage natural gas. Supporting calculations for certified natural gas emission estimates are found below in Section 6.
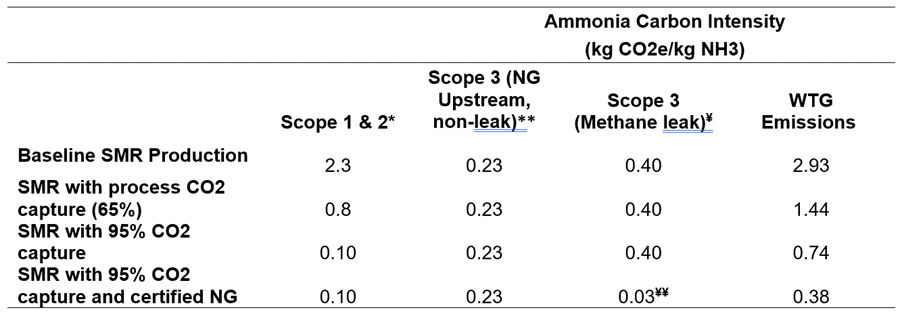
**Upstream non-leak CO2e scope 3 emissions from Argonne’s 2022 GREET Clean Hydrogen Pathways report.
¥ Methane baseline emissions from MiQ-Highwood Index (2023).
¥¥ Certified methane emissions from theoretical MiQ A grade supply chain emissions, see Section 6.
4. Summary
Ammonia producers may realize upwards of a 90% reduction in their scope 3 emissions through purchase of upstream reduced methane leakage natural gas (Elgowainy, 2022). Compared to the US national average established by the MiQ-Highwood Index, a certified natural gas supply chain could reduce overall lifecycle GHG emissions from ammonia by approximately 15% for traditional SMR production and well over 50% for blue ammonia. Because of credible, transparent and tracked certification schemes, the reliability of these reductions is tracible and auditable for support towards any voluntary or regulatory emissions reduction program.
Modeled emission estimates lack the granularity and operator-specific inputs necessary to demonstrate true regional emissions. Compared to national inventories or baseline models, certification provides greater accuracy in the lifecycle analysis through the following ways:
- Each segment is accounted for and applies a unique and customized Emissions Accounting Standard.
- Each accounting standard is backed up by extensive stakeholder review, latest scientific studies, and quantitative monitoring technology capabilities.
- Operators are required to provide specific inputs to achieve granular emission estimates, including impacts from equipment types, specific geography, production types, gas to oil ratio, operating pressures, and distance of transport to gas buyer.
- MiQ includes reinforcing safeguards including enhanced monitoring requirements and preventative company practices to minimize uncertainty to less than 0.05% methane intensity for A grades.
- MiQ certification requires reconciliation of top down (quantitative monitoring) as well as bottom-up emission calculations to minimize or eliminate uncertainty and fat-tail divergence.
- Certification is timely and data inputs are accurate to the year of production.
- Independent third party auditors are required for certification to verify emissions data and performance criteria.
- Credible digital registries are required to link supply chain emissions, track and retire certificates as well as prevent double counting on emission reduction claims.
Certification can also be instrumental in providing incentives for interested natural gas producers and industrial end-users to develop a robust and functioning market for lower methane intensity natural gas that will result in further emissions reductions.
Certificate markets, backed up by credible principles and registries, operate in much the same way utilizing Renewable Energy Certificate (REC) and Biogas Renewable identification numbers (RIN) markets to trade and distribute certified natural gas to meet demand wherever it might be located. In the same way RECs and RINs are applied to current voluntary disclosure and regulatory reporting programs for emissions.
With specific, audited and registry tracked emission information, therefore, certified natural gas represents an important pathway for emissions reductions by industrial natural gas end-users that will, once the system is widely deployed, provide a substantial opportunity for very significant emissions reductions.
5. References
Alvarez, R. A., et al (2018). Assessment of methane emissions from the US oil and gas supply chain. Science, 361, 186–188. 10.1126/science.aar7204
Burnhan, A. (2021) Updated Natural Gas Pathways in GREET 2021, US DOE, Argonne National Laboratory. https://greet.es.anl.gov/files/update_ng_2021
Elgowainy, A., et al (2022). Hydrogen Life Cycle Analysis in Support of Clean Hydrogen Production, US DOE, Report ANL/ESIA-22/2. https://doi.org/10.2172/1892005
Lee, K., et al (2022) Techno-economic performances and life cycle greenhouse gas emissions of various ammonia production pathways including conventional, carbon-capturing, nuclear-powered, and renewable production. Green Chem.,24, 4830-4844. https://doi.org/10.1039/D2GC00843B
Rutherford, J., et al (2023) The MiQ-Highwood Index: A national-scale measurement-informed methane intensity for the United States. https://miq.org/wp-content/uploads/2023/06/MiQ-Highwood-Index.pdf
Rutherford, J., et al (2021) Closing the methane gap in US oil and natural gas production emissions inventories. Nat Commun 12, 4715. https://doi.org/10.1038/s41467-021-25017-4
Masson-Delmotte, V., et al (2021). Climate Change 2021: The Physical Science Basis. Contribution of Working Group I to the Sixth Assessment Report of the Intergovernmental Panel on Climate Change. Cambridge, United Kingdom and New York, NY, USA: Cambridge University Press. Retrieved from https://www.ipcc.ch/report/ar6/wg1/
US Department of Energy’s Clean Hydrogen Production Standard (2022), referred from https://www.hydrogen.energy.gov/pdfs/clean-hydrogen-production-standard.pdf
6. Supporting Information
Derivation of Methane and Carbon Intensity for Certified MiQ “A-grade” Natural Gas emissions pathway
Assumptions:
- MiQ A grade for Production, Gathering & Boosting, Processing & Transmission Segments
- LHV NG = 0.95 MMBTU/Mscf
- Methane Content = 1 vol frac
- Methane Density = 0.0192 MT/Mcf
- CF Throughput = 280,000,000 MMBTU NG/yr
- Pipeline Mileage = 500 mi
- “Shrinkage (Production -> T&S)” = ignored
- T&S “A” Grade 3.00 = MT/mi
- GWP-100 = 29.8 gCO2e/gCH4
